
Cell C’s missing R10 billion

Cell C cannot explain why there is a R10 billion difference in the assets on its balance sheet between its reporting and that of its largest shareholder, Blue Label.
Cell C’s financial reporting has always been unreliable, with inconsistent metrics and conflicting numbers. This makes it impossible to accurately track its performance.
In November 2023, for example, Cell C published a trading update which included its audited numbers for its 2021 and 2022 financial years.
What stood out was that the figures Cell C shared with the market differed significantly from the previous market updates.
Cell C previously reported a R2.45 billion profit in its 2021 financial year. That was changed to a R92 million loss.
It also previously reported earnings before interest, taxes, depreciation and amortisation (EBITDA) of R2.85 billion for its full year 2021.
This trading update states that EBITDA for the 2021 financial year was only R0.2 billion, 92% lower than in the previous report.
Cell C CFO El Kope explained that the discrepancy between previous reports and the more recent updates is that the latest figures were audited.
“Previous numbers we provided to the market were not audited. The numbers we are now sharing are fully audited,” she said.
These examples of conflicting financial information are not unique. In fact, they have been the norm with Cell C for years.
After Jorge Mendes took over as Cell C CEO, the company promised more consistent and transparent financial reporting to the market. This did not happen.
The same inconsistent metrics and conflicting numbers continue to make it challenging for analysts to figure out what is really happening at Cell C.

Cell C’s missing R10 billion
Cell C’s unaudited financial results for the 12 months ended 31 May 2025 provide a good example of its inconsistent financial reporting.
As part of its results, Cell C said it had a stronger balance sheet on a structurally improved footing.
It said its assets increased by 22% to R5.072 billion. This was partly because the company recognised deferred tax assets in the current year as it returned to profitability.
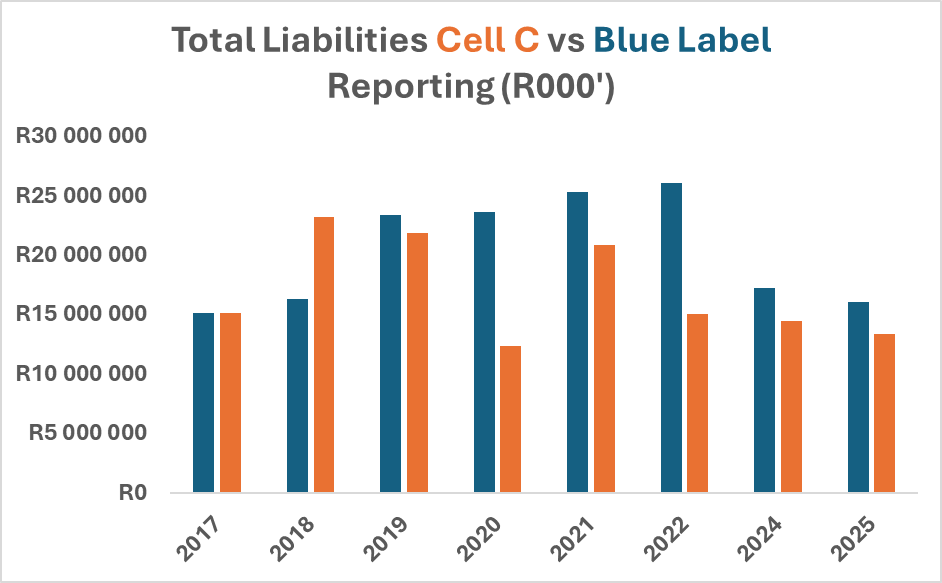
Total liabilities increased by 8% to R13.379 billion. It said the reduction in the trade and other payables was offset by the increase in non-current shareholder debt.
Cell C explained that related party debt transactions account for approximately 60% of the total liabilities.
Curiously, Blue Label Telecoms also reported on Cell C’s balance sheet, and it looked completely different from that of the mobile operator.
According to Blue Label, Cell C had R15.020 billion in assets and R16.065 billion in liabilities, which is a huge difference from what Cell C reported.
MyBroadband asked Cell C why there was such a large difference between its numbers and those of Blue Label. However, Cell C preferred not to answer this question.
Cell C could also not say which balance sheet numbers the market should trust and use for their financial models.
The table below shows the difference between Cell C and Blue Label Telecoms’ financial reporting for the 2025 financial year.
| Measure | Cell C’s financial report | Blue Label’s financial report | Difference |
| Total Assets | R5.074 billion | R15.020 billion | R9.946 billion |
| Total Liabilities | R13.379 billion | R16.065 billion | R2.686 billion |
| Equity | -R8.305 billion | -R1.044 billion | R7.261 billion |
Cell C Balance Sheet: Blue Label versus Cell C’s reporting
The charts and tables below show the difference in financial reporting about Cell C from its main shareholder, Blue Label Telecoms, and from Cell C itself.


| Blue Label’s Financial Reporting (R ‘000) | |||
| Year | Assets | Liabilities | Equity |
| 2017 | R18,948,000 | R15,187,000 | R3,761,000 |
| 2018 | R26,986,501 | R16,369,435 | R10,617,066 |
| 2019 | R26,114,208 | R23,440,038 | R2,674,170 |
| 2020 | R15,641,155 | R23,653,860 | -R8,012,705 |
| 2021 | R19,794,981 | R25,354,319 | -R5,559,338 |
| 2022 | R18,138,711 | R26,146,559 | -R8,007,848 |
| 2024 | R14,130,474 | R17,309,515 | -R3,179,041 |
| 2025 | R15,020,220 | R16,064,638 | -R1,044,418 |
| Cell C’s Financial Reporting (R ‘000) | |||
| Year | Assets | Liabilities | Equity |
| 2017 | R18,949,193 | R15,188,320 | R3,760,873 |
| 2018 | R25,644,191 | R23,240,952 | R2,403,239 |
| 2019 | R13,943,000 | R21,898,000 | -R7,955,000 |
| 2020 | R8,001,000 | R12,412,000 | -R4,411,000 |
| 2021 | R6,334,000 | R20,922,000 | -R14,588,000 |
| 2022 | R5,798,000 | R15,092,000 | -R9,294,000 |
| 2024 | R4,159,016 | R14,542,391 | -R10,383,375 |
| 2025 | R5,074,000 | R13,379,000 | -R8,305,000 |


 Loading ...