In the case of say analyzing roof deflection, a human draws an area they want analyzed on a previously reconstructed 3D model.
The point cloud is then cut along that polygon with a reasonable buffer to reduce the amount of data needed to be analyzed.
The challenge is then to best fit a plane to the structure of the roof, ignoring noisy data, trees which may have grown over parts, conduits, aircons, solar panels, debris etc. Once that's done we basically spit out and save the equation of that plane in point-normal form.
The 3D model (with faces) is then compared to that plane to generate a map of the deflections of the physical roof. That plane is then colored similar to this random picture from the internet and overlaid on the 3D model for display and further analysis to the user (comparing pitch of one side of the roof to the other etc.
Edit: In practice it looks something like this, only the model is real world data.


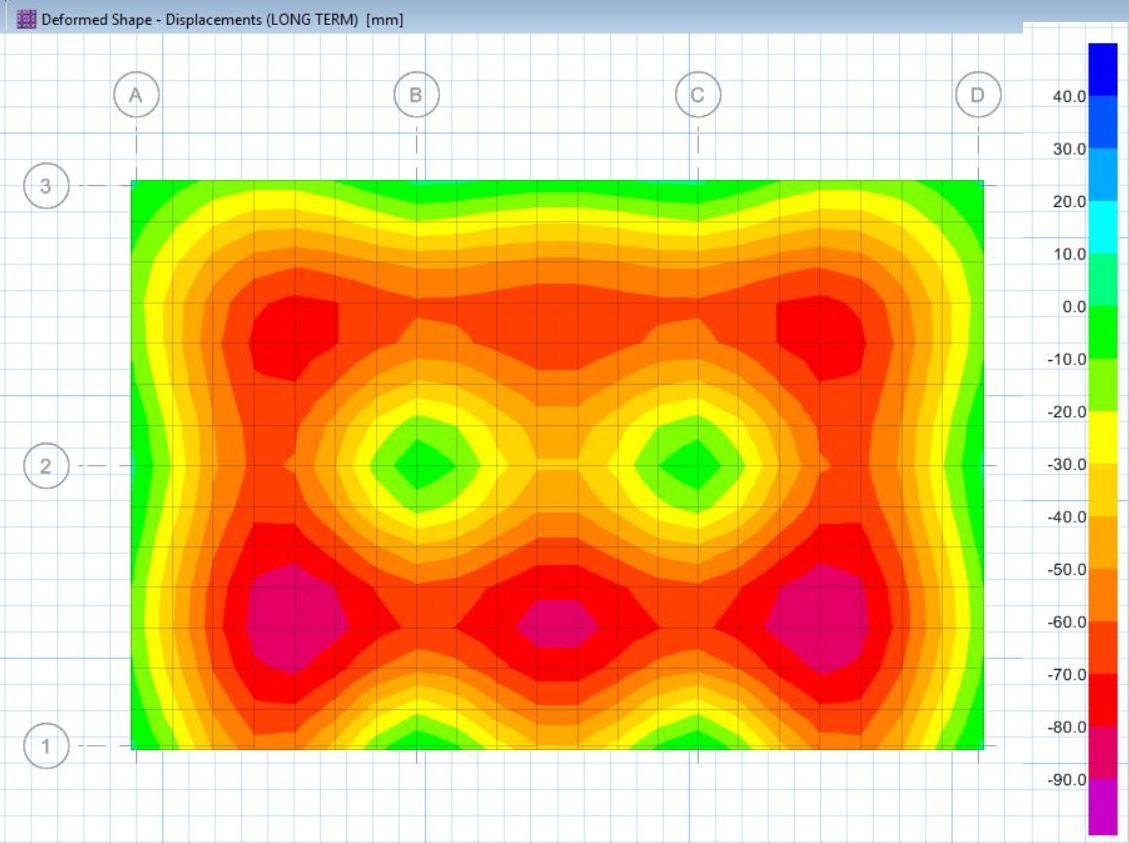

")