Bombshell Claim: Scientists Find "Man-made Climate Change Doesn't Exist In Practice"

But you said you don't know what that is....
Do you know how to use Google?
Do you know how to further your own education by reading things?
So you can't find a reasonable definition. Lol. The nonsense you post is pure incoherent propaganda. It isn't even good enough that I can address any point it tries to make because the very premise is wrong and badly defined.
 
So you can't find a reasonable definition. Lol. The nonsense you post is pure incoherent propaganda. It isn't even good enough that I can address any point it tries to make because the very premise is wrong and badly defined.

Hey, you're the one who said you had no idea what it was.
I pointed you in the right direction.
It's not my job to educate you, that would be your parents shortcomings.
 
Quote a definition for modern climate change.

As per the Glossary of Terms in the IPCC AR5 (Annex III): Climate Change means:

Climate change
Climate change refers to a change in the state of the climate that can be identified (e.g., by using statistical tests) by changes in the mean and/or the variability of its properties, and that persists for an extended period, typically decades or longer.
Climate change may be due to natural internal processes or external forcings such as modulations of
the solar cycles, volcanic eruptions and persistent anthropogenic changes in the composition of the atmosphere or in land use
.
Note that the Framework Convention on Climate Change (UNFCCC), in its Article 1, defines climate change as:

a change of climate which is attributed directly or indirectly to human activity that alters the composition of the global atmosphere and which is in addition to natural climate variability observed over comparable time periods’.​

The UNFCCC thus makes a distinction between climate change attributable to human activities altering the atmospheric composition, and climate variability attributable to natural causes.
See also Climate change commitment, Detection and Attribution.

The UNFCCC rejects the possibility that CC is "caused" by natural variability.

The IPCC definition "sits on the fence", "just in case" in my opinion. That means (for me) that the cause-effect relationship is still not all that conclusive. i.e. CC is caused by man-made forcings.
 
As per the Glossary of Terms in the IPCC AR5 (Annex III): Climate Change means:


The UNFCCC rejects the possibility that CC is "caused" by natural variability.

The IPCC definition "sits on the fence", "just in case" in my opinion. That means (for me) that the cause-effect relationship is still not all that conclusive. i.e. CC is caused by man-made forcings.
He knows exactly what it is, he's just trolling this thread.
 
These studies still don't take into account the the more data points in recent history, makes climate change in recent history appear more volatile.

This is really basic stats. With more data points your graph is going to jump around more and we don't have data for most places going 100 years back.

To convert me to a "climate change believer" I just need one long term study that use stats properly and work on a reasonable term moving avarerge to show how fast the climate in increasing compared to previous times the climate also increased and that it is at an accelerated speed now.
 
To convert me to a "climate change believer" I just need one long term study that use stats properly and work on a reasonable term moving avarerge to show how fast the climate in increasing compared to previous times the climate also increased and that it is at an accelerated speed now.

How long?
 
What does the WMO say about the subject? Personally, the WMO is a much better source if one is looking for rational and emotionless Scientific definitions.
The WMO defines two terms which the UNFCCC and the IPCC and all the so-called "Consensus CC Scientists" appear to conflate [use as synonyms, interchangeably] all too often. "Climate Variability" & "Climate Change"

What is Climate Variability?
Climate Variability is defined as variations in the mean state and other statistics of the climate on all temporal and spatial scales, beyond individual weather events.
The term "Climate Variability" is often used to denote deviations of climatic statistics over a given period of time (e.g. a month, season or year) when compared to long-term statistics for the same calendar period. Climate variability is measured by these deviations, which are usually termed anomalies.
Variability may be due to natural internal processes within the climate system (internal variability), or to variations in natural or anthropogenic external factors (external variability).

What is Climate Change?
Climate change refers to a statistically significant variation in either the mean state of the climate or in its variability, persisting for an extended period (typically decades or longer).
Climate change may be due to natural internal processes or external factors such as persistent changes to the atmosphere or changes in land use.
Article 1 of the United Nations Framework Convention on Climate Change (UNFCCC) defines "climate change" as:
"a change of climate which is attributed directly or indirectly to human activity that alters the composition of the global atmosphere and which is in addition to natural climate variability observed over comparable time periods”​

The UNFCCC thus makes a distinction between "climate change" attributable to human activities altering the atmospheric composition, and "climate variability" attributable to natural causes.
Care must be taken not to confuse variability with change. Many regions of the world experience greater variability, climatologically speaking, than do others. In some parts of the world, or in any region for certain time periods or parts of the year, the variability can be weak (i.e. there is not much difference in the conditions within that time period). In other places or time periods, the conditions can swing across a large range, from freezing to very warm, or from very wet to very dry and exhibit strong variability.
 
Last edited:
As per the Glossary of Terms in the IPCC AR5 (Annex III): Climate Change means:


The UNFCCC rejects the possibility that CC is "caused" by natural variability.

The IPCC definition "sits on the fence", "just in case" in my opinion. That means (for me) that the cause-effect relationship is still not all that conclusive. i.e. CC is caused by man-made forcings.
I have no problem with the definition of just "climate change" climate and change is quite self evident. The climate changes over time.

Modern Climate Change Is the Only Worldwide Warming Event of the Past 2,000 Years
But I didn't find a definition of exactly when the modern period is nor have I even tried to go further and make sense of the rest of that nonsense sentence posted by LazyLion.
 
These studies still don't take into account the [that] the more data points in recent history, makes climate change in recent history appear more volatile. This is really basic stats. With more data points your graph is going to jump around more and we don't have data for most places going 100 years back. To convert me to a "climate change believer" I just need one long term study that uses stats properly and works on a reasonable term 'moving average' to show how fast the climate is increasing compared to previous times [when] the climate [temperature] also increased and that it is at an accelerated speed now.

Absolutely spot on. That is why in my opinion, the cause-effect relationship [between CC and man-made forcings] is still not sufficiently shown by any of the so-called studies done so far.
 
Last edited:
Absolutely spot on. That is why in my opinion, the cause-effect relationship is still not sufficiently shown by any of the so-called studies done so far.
Well if they get all that right. Then we can start talking about cause and effect and the severity of the change. I'm sure there's plenty of extreme causes in the past aswell.
 
The local CC brigade made lots of noise about the rather unusual Southern Indian Ocean Cyclones that affected Mocambique, Malawi, Zimbabwe etc.
The rhetoric goes "you see here is an example of how CC is affecting us all"

The WMO takes a much more balanced view of how to interpret unusual weather events.

Occasionally, an event or sequence of events occurs that has never been witnessed before (or recorded before), such as the exceptional hurricane season in the Atlantic in 2005. Yet even that could be part of natural climate variability. If such a season does not recur within the next 30 years, we would look back and call it an exceptional year, but not a harbinger of change. Only a persistent series of unusual events taken in the context of regional climate parameters can suggest a potential change in climate has occurred.
 
The local CC brigade made lots of noise about the rather unusual Southern Indian Ocean Cyclones that affected Mocambique, Malawi, Zimbabwe etc.
The rhetoric goes "you see here is an example of how CC is affecting us all"

The WMO takes a much more balanced view of how to interpret unusual weather events.
Interesting that they work on 30 years when we have 100 year flood lines.

http://aed.co.za/wp/flood-lines/
 
To convert me to a "climate change believer" I just need one long term study that use stats properly and work on a reasonable term moving avarerge to show how fast the climate in increasing compared to previous times the climate also increased and that it is at an accelerated speed now.

https://en.wikipedia.org/wiki/File:All_palaeotemps.png#Summary

Now keep in mind if you normalized the entire 500 million years represented in that graph, the final spike you see represents change within +- 50 years or so, which would represent an area of 0.0000007% on that entire graph... so this picture doesn't even come remotely close to showing it as it is.

That kind of fluctuation without an actual event such as vulcanism, major solar aberrations or a meteor strike etc. etc. is stunning to say the least. That final spike is simply put: gargantuan when you take the context of what science knows about the planet's history and climate in general.

This data is just an aggregation of temp data used all over the scientific literature.
Cutting through all the bullsh1t, this graph actually shows you exactly what you want to see if you even remotely have the ability to recognise what is represents and how hideously inadequate it is at properly showing the insanity in that last temp. spike. Not only is it eye opening, i personally think it should send shivers down one's spine.

Also, trash the idea of AGW as much as you want, but keep this in mind: If those temperature estimations for 2050 and 2100 on the graph is even remotely accurate then I truly don't know anymore what kind of easily digestible evidence you need to stop talking kak.
 

Attachments

  • All_palaeotemps.png
    All_palaeotemps.png
    90.5 KB · Views: 9
Last edited:
The BBC version, with links: https://www.bbc.com/news/science-environment-49086783

The three papers have been published in the journals Nature (1) and Nature Geoscience (2), (3).

https://www.nature.com/articles/s41586-019-1401-2
https://www.nature.com/articles/s41561-019-0402-y
https://www.nature.com/articles/s41561-019-0400-0

Earth’s climate history is often understood by breaking it down into constituent climatic epochs. Over the Common Era (the past 2,000 years) these epochs, such as the Little Ice Age, have been characterized as having occurred at the same time across extensive spatial scales. Although the rapid global warming seen in observations over the past 150 years does show nearly global coherence, the spatiotemporal coherence of climate epochs earlier in the Common Era has yet to be robustly tested. Here we use global palaeoclimate reconstructions for the past 2,000 years, and find no evidence for preindustrial globally coherent cold and warm epochs. In particular, we find that the coldest epoch of the last millennium—the putative Little Ice Age—is most likely to have experienced the coldest temperatures during the fifteenth century in the central and eastern Pacific Ocean, during the seventeenth century in northwestern Europe and southeastern North America, and during the mid-nineteenth century over most of the remaining regions. Furthermore, the spatial coherence that does exist over the preindustrial Common Era is consistent with the spatial coherence of stochastic climatic variability. This lack of spatiotemporal coherence indicates that preindustrial forcing was not sufficient to produce globally synchronous extreme temperatures at multidecadal and centennial timescales. By contrast, we find that the warmest period of the past two millennia occurred during the twentieth century for more than 98 per cent of the globe. This provides strong evidence that anthropogenic global warming is not only unparalleled in terms of absolute temperatures, but also unprecedented in spatial consistency within the context of the past 2,000 years.
 
Last edited:
While this thread is active, more fake news: https://www.esi-africa.com/industry...-ed-climate-change-a-different-point-of-view/
A little recognised fact known by most experts in the world is that CO2’s heat absorption capacity diminishes logarithmically so that doubling of the CO2 content in the atmosphere from 0.04% to 0.08% (which would take probably 200 years) would add about 1 degree of warming and so on…not more. The concentration of CO2 is so small that it constitutes only 0.038% of the Earth’s atmosphere and accounts for only 3.6% of greenhouse gasses.

In any event, as noted by Dr Patrick Moore, and supported by much research by others, Anthropogenic CO2 has one very significant benefit that the public is not informed about. It greens the Earth and increases biomass which is much needed to feed our growing population and animal life.

Manmade CO2 has added over 15% to global biomass alone in the past decades…so fossil power plants add far more biomass (indirectly trees) than activists are able to plant. Even NASA agrees. Just recently even the Davos World Economic Forum admitted the benefits of CO2, this is a big step in the right direction!

The physicist and climate scientist Ed Berry highlighted the major flaw in the IPCCs fundamental hypothesis. The IPCC’s Big Idea is that nature treats human CO2 emissions differently than it treats nature’s CO2 emissions. This violates the Equivalence Principle, therefore it is wrong.

Einstein used the Equivalence Principle to develop his General Theory of Relativity. He realised that data cannot tell the difference between gravity and inertial forces. Therefore, they are the same thing. This equivalence is the foundation of Einstein’s General Theory of Relativity that is used today.

The Big Idea is that nature balances natural CO2 but does not balance human CO2. This is impossible because it violates the Equivalence Principle. In summary, it says that if data cannot distinguish between two things then the two are identical.

The IPCC claims that human CO2 remains the atmosphere for hundreds of years and 15% will remain permanently remain. Natural CO2 has a half-life of 2.8 years and is reabsorbed. Nature balances CO2 inflows into the atmosphere and reabsorbs the same quantity as nature cannot recognise the difference between natural CO2 and human CO2. The IPCC claims that the CO2 increase from 280ppm in 1750 to 410 ppm has all been caused by human emissions of CO2. In practice, science suggests the ratio of human to natural CO2 is 4.6%. Calculations show that since 1750 human CO2 emissions have added just 18 parts per million to the CO2 levels of 410ppm.

Nature is responsible for the remaining 392 ppm of CO2. If human beings stopped all CO2 emissions this would cause a falloff of just 18ppm from the current level of 410ppm or 4.4%. This is a breach of the Equivalence principle.

The global situation was put very succinctly in an address in 2018 by Richard Lindzen Professor of Atmospheric Physics at MIT in the US, and now Emeritus Professor. His paper has compelling remarks about the benefits to the planet of CO2 and the futility of current efforts to change the climate by attempting to limit CO2. Two of the most informative and convincing statements he made were:

“An implausible conjecture backed by false evidence and repeated incessantly has become politically correct ‘knowledge,’ and is used to promote the overturn of industrial civilisation”

“Presumably, the power these people desperately seek includes the power to roll back the status and welfare that the ordinary person has acquired and continues to acquire through the fossil fuel-generated industrial revolution and return them to their presumably more appropriate status as serfs. Many more among the world' poorest will be forbidden the opportunity to improve their condition.”
 
https://en.wikipedia.org/wiki/File:All_palaeotemps.png#Summary

Now keep in mind if you normalized the entire 500 million years represented in that graph, the final spike you see represents change within +- 50 years or so, which would represent an area of 0.0000007% on that entire graph... so this picture doesn't even come remotely close to showing it as it is.

That kind of fluctuation without an actual event such as vulcanism, major solar aberrations or a meteor strike etc. etc. is stunning to say the least. That final spike is simply put: gargantuan when you take the context of what science knows about the planet's history and climate in general.

This data is just an aggregation of temp data used all over the scientific literature.
Cutting through all the bullsh1t, this graph actually shows you exactly what you want to see if you even remotely have the ability to recognise what is represents and how hideously inadequate it is at properly showing the insanity in that last temp. spike. Not only is it eye opening, i personally think it should send shivers down one's spine.
So wild fluctuations in the climate seem to be pretty much the norm.

Seems strange that the last 10000 years were almost flat.
I don't see a gargantuan final spike that's out of the norm. I see the ridiculous end of world 2050 and 2100 forecasts though.
 
Last edited:
The earth and life on it can handle a bit of an increase in average temperature. It can't handle low CO2 levels and more CO2 is good for plants which is the basis of all life on earth. So CO2 is good as long as we plant more and halt the massive deforestation. Farmers even pump CO2 into their greenhouses to 3 or 4 times the atmospheric level by burning fossil fuels to increase crop yields but not many are aware of this.

A study of the last 35 years shows how CO2 has made the planet greener:

From a quarter to half of Earth’s vegetated lands has shown significant greening over the last 35 years largely due to rising levels of atmospheric carbon dioxide

https://www.nasa.gov/feature/goddard/2016/carbon-dioxide-fertilization-greening-earth


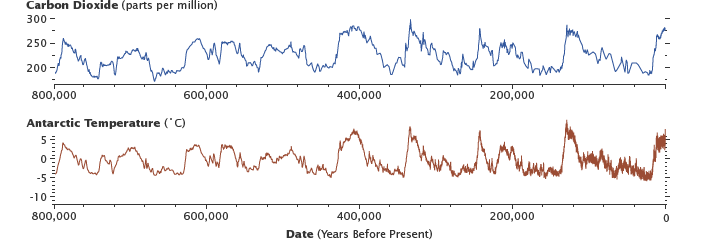
Also here's the CO2 levels for the last 800k years. There is a cycle and the low point was always about 180ppm. Apparently this is because once CO2 goes too low, the plants start dying and can't grow as well so less CO2 is then absorbed from the atmosphere, resulting in CO2 levels increasing again. Once it gets high enough the plants thrive again and it caps out and starts dropping until the plants start dying again.


epica_CO2_temperature.png


https://earthobservatory.nasa.gov/features/CarbonCycle/page4.php

Life on earth was actually at it's peak back when the CO2 levels were about 2000 to 3000 ppm during the Triassic period (currently around 400ppm). We are now left with only the toughest plant species that evolved to survive in a low CO2 environment.
 

Okay so, this article is declared "fake news".
How about pointing out why?
Are any of the "facts" wrong?
Are any of the statements about Scientific Principles wrong?
Is it the interpretation of those facts and principles that is wrong?
Is it the assertion that the total sum of all the efforts will do nothing?
Is it because at the end of it all, the trend will continue regardless?
 
Last edited:
Top
Sign up to the MyBroadband newsletter
X